How to create a beautiful scientific poster?
There are scientists who are fluent with (digital) pen and paper. They combine their passion for research with a passion for graphic design and create beautiful and funny scientific illustrations. There is Baryon from physicist Koen van den Eeckhout (only in Dutch), Somersault1824 from biomedical scientists Luk en Idoya and Scigrades from marine biologist Pieter Torrez.
They will gladly help you visualising your scientific data and they proof that it is possible for a researcher to design a beautiful poster. But what if you want to do it yourself? How do you start if you can’t even recognize a pencil from an eraser?
Pieter Torrez pored some of his secrets in this blogpost. Enjoy!
————————————————————-
ENTER PIETER
————————————————————-
As a marine scientist with a creative mind I started studying biology at the University of Ghent. As soon as I got more and more involved into the academic world through conferences and presentations by researchers I experienced a lack of adequate graphic skills in scientific research.
But how do you decide which graphic elements are needed in your poster presentation if you don’t have a background in graphic design?
Here are 5 tips which can greatly improve the appearance of your scientific poster and improve the outreach of your research:
1. Draw a scheme of your scientific poster
Start by drawing a sketch with the non-visual (=text) and visual elements (graphs, images, 3D model,..) you are going to use and in which kind of programs you will be able to do this.
There are numerous of graphic design programs that can be used for free to design your poster.
- Inkscape is a popular illustration program.
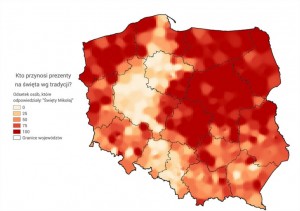
- With Rstudio and the extra ggplot2 package, you can create wonderful graphics. It can take a while to start with R but once you are acquainted with the software the possibilities are endless. You can find several R beginner courses on the internet. Two popular sites for R-info are www.r-bloggers.com and www.zevross.com. On these sites you can find the R coding language of example datasets which you can copy and change the parameters to customize your graphs.
- Qgis is a free and open source geographic information system to plot your data on a map. The last years a lot of beginner tutorials have been published on youtube which makes the learning curve less steep.
If you don’t know which kind of scientific visualization program you need for your data or if you lack the skills in how to use these programs go to Clarafi for more info about the different tools. A (free) guide with useful tips to design scientific figures can be found here: http://www.illuscientia.com/resources/free-pdf/
2. Use max. 2-3 different colours
Onderschat het belang van kleur in je poster niet!
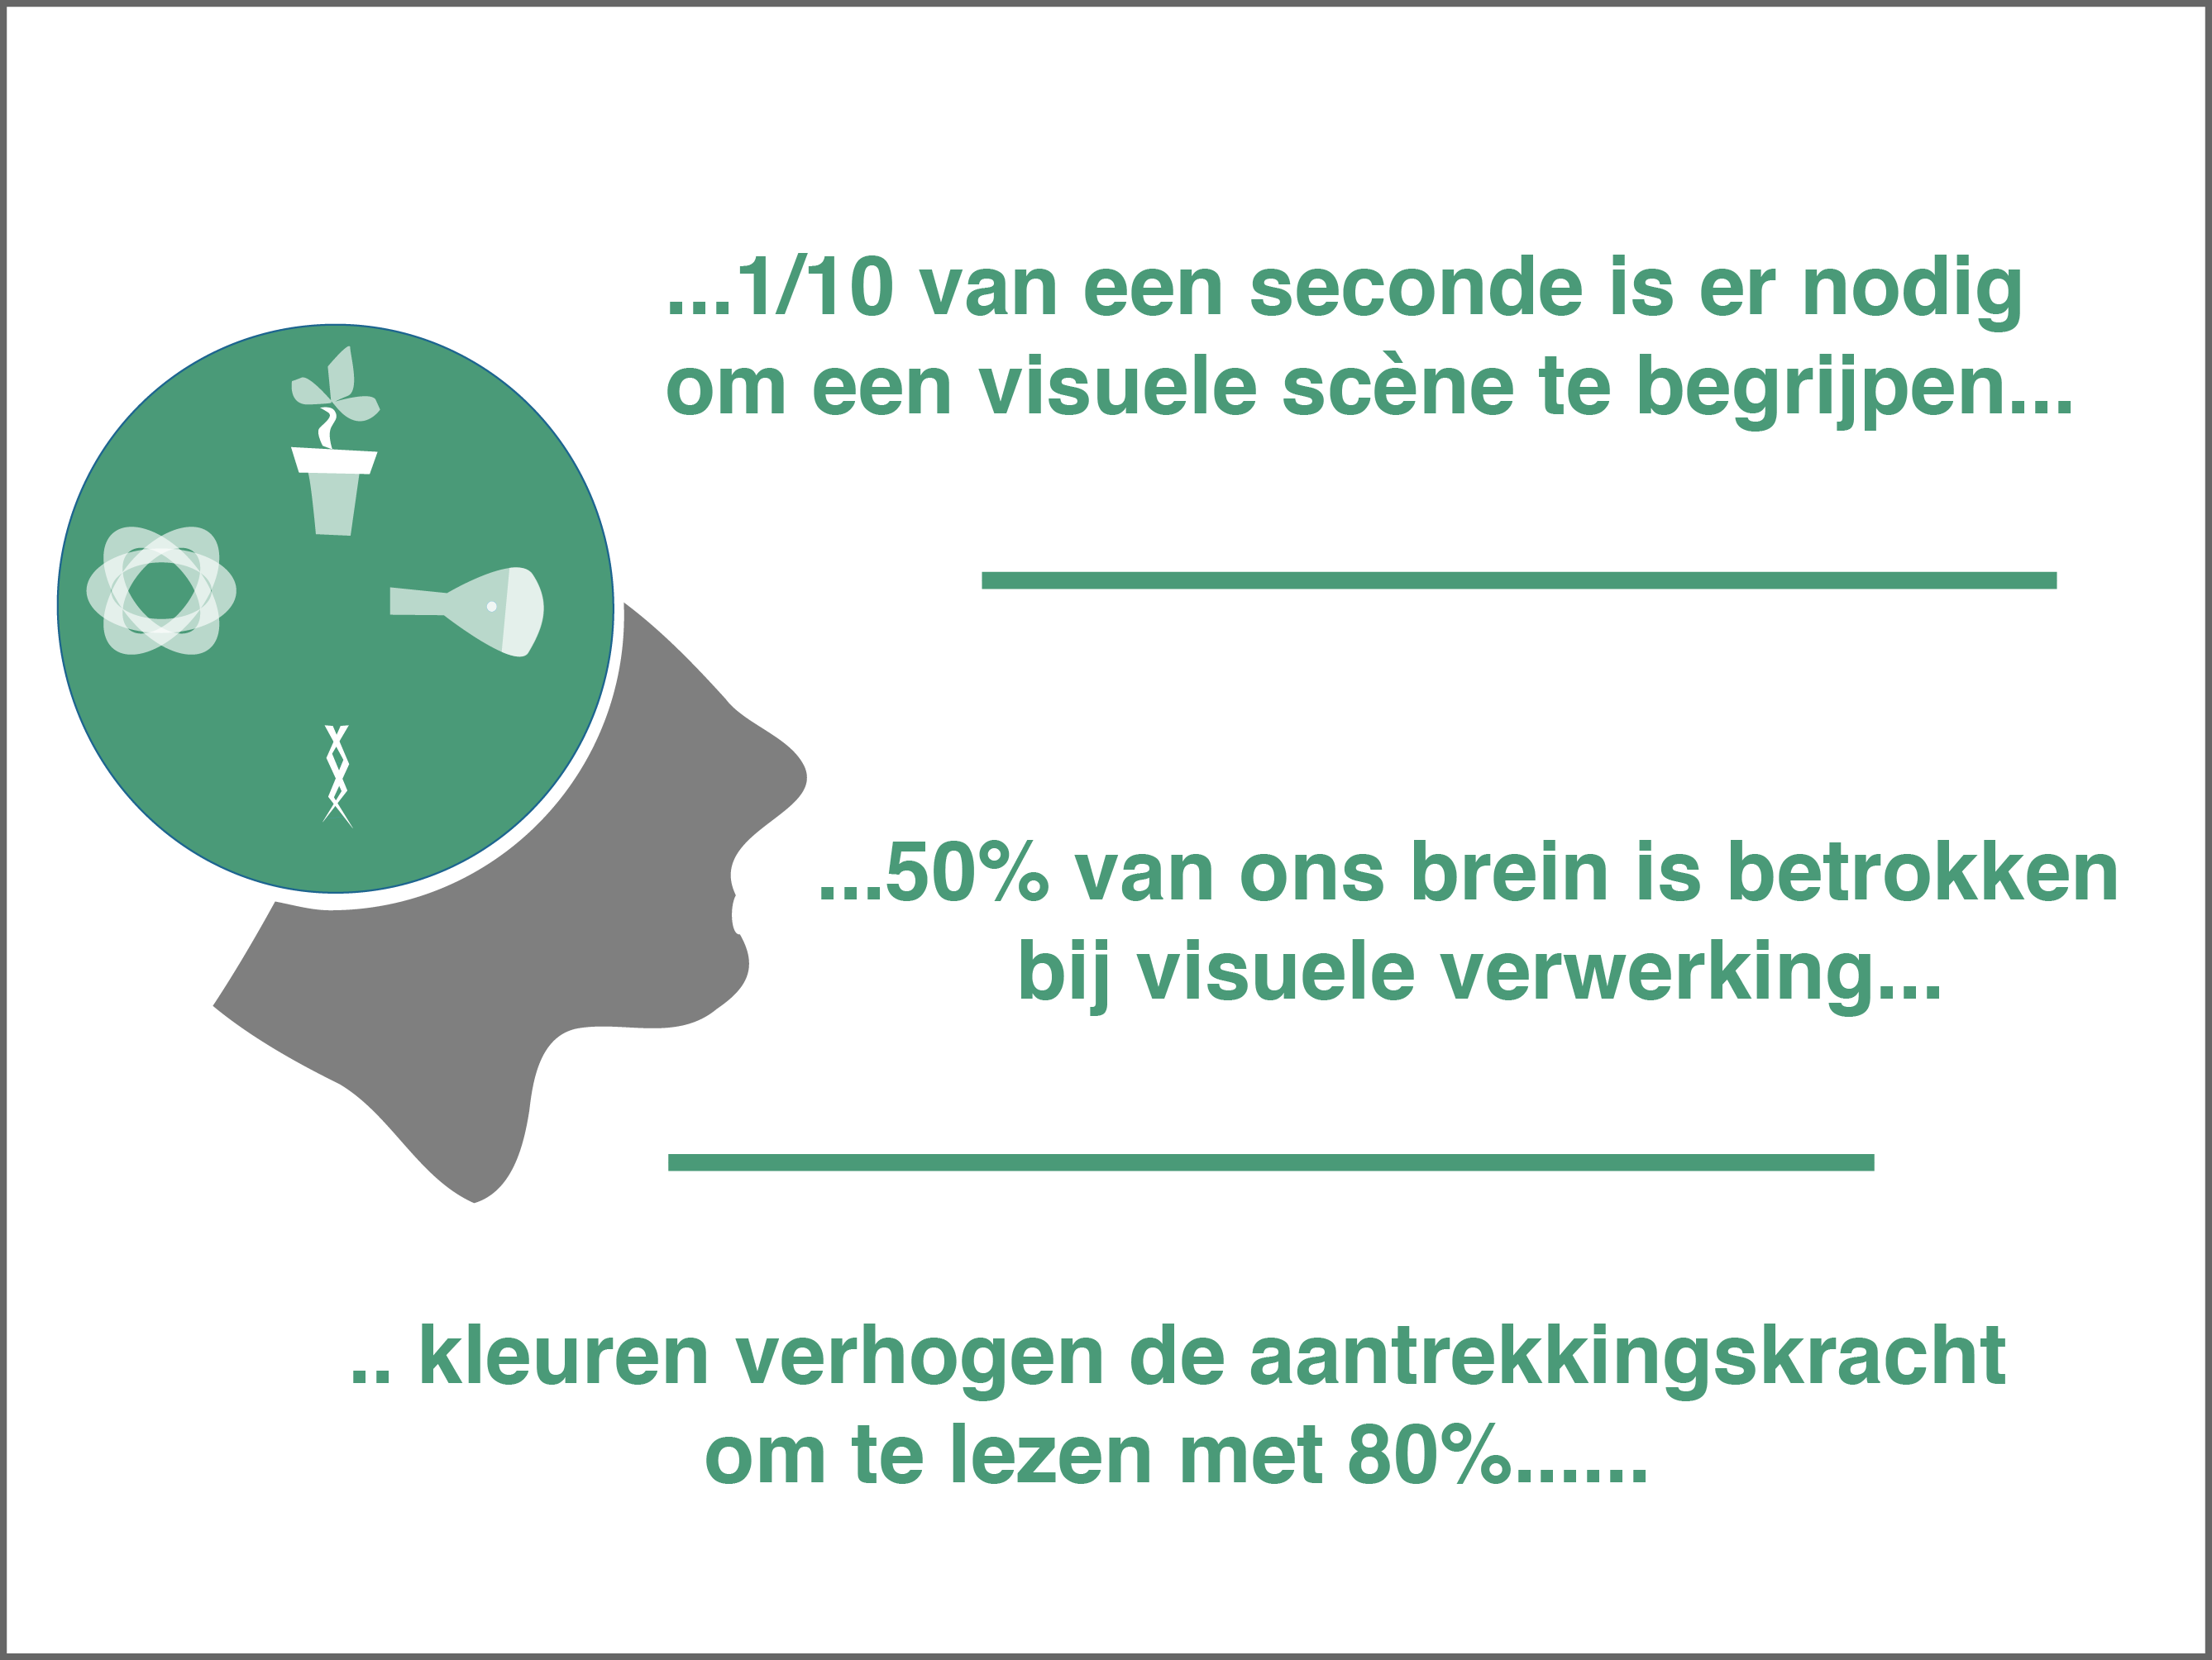
Don’t underestimate the use of colours! Colours have a graphical and functional role. Firstly they invite the reader to stop at your poster, secondly colours are used to structure the information (titles, subtitles,..) so readers can easily process the information. The more colours the poster involves, the harder it comes to see through the structure of the poster and the less appealing it will be to read further.
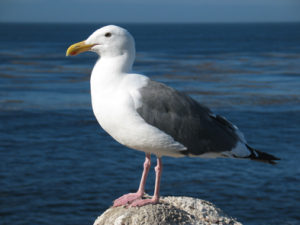
Ideally you should use 2-3 colours who fit well with each other. If you don’t know which colours to pick, it is useful to use colours which can link the poster to an institute/university or topic. For example the yellow and blue colours from the University of Ghent can be used with a white tinted background. If you do research on gulls you can use the darkgrey and yellow colours of the bird to colour the text. The reader will link these colours unconsciously to your institute/topic.

You can get inspiration from your own research. If I did research on seagulls, I could use the yellow from the beak and the darkgrey from the wing.
A tool I often use is the eyedropper tool, it allows you to pick a colour from a picture, logo, .. so you can get the colour code and use it in your poster.
To get an eyedropper you can use the following programs to find the colorcode of your image.
- Paint (Windows)
- imagecolorpicker.com (online)
- instant-eyedropper.com (desktop)
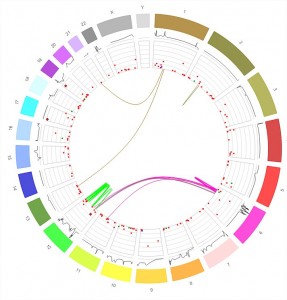
3. Accompany your text with the right visuals
The use of visuals (images, graphs,..) can be very beneficial to your poster. Only use visuals which support the information given in the text. Don’t overuse visuals, select the most important ones with the best quality. Add a line of information beneath the visual so the reader knows what he sees.
4. Reduce the amount of text
1/10 of a second is needed to get the sense of a visual scene. It is important to reduce the text as much as possible and to write your information to the point.
Remember, there are no scientific events where you get a price for the number of words. Icons can be useful to replace text but be aware that some icons can have multiple meanings. Popular sites to find icons are iconfinder, icons8 and the nounproject.
5. Add a picture of yourself
Adding a picture of yourself at the bottom of the poster can help potential readers to find you in the crowd and to establish new contacts (and that is one of the main reason why you want to make a scientific poster, no?)
If you can’t be present at the conference to answer potential questions you can add a little box with sheets with an extensive summary of your research supporting the content of your scientific poster.

—————————–
This text was written by Pieter Torrez, a Belgian marine scientist who offers graphic support to scientists and scientific institutions (Visual summary of research, interactive infographics, scientific figures,..). Visit www.scigrades.be for more info, you can reach Pieter by mailing to torrez.pieter@gmail.com.
More tips for a winning scientific poster?
- Check out our book How to Stand Out With Your Scientific Poster. It gives you an easy, quick, step-by-step approach for scientific posters that make a difference.
- Or book a poster workshop. We trained thousands of researchers to build scientific posters. Fact: Participants consistently rate our poster workshop 9.5/10 and yes, we have the data to back it up.